Multifamily development pro forma
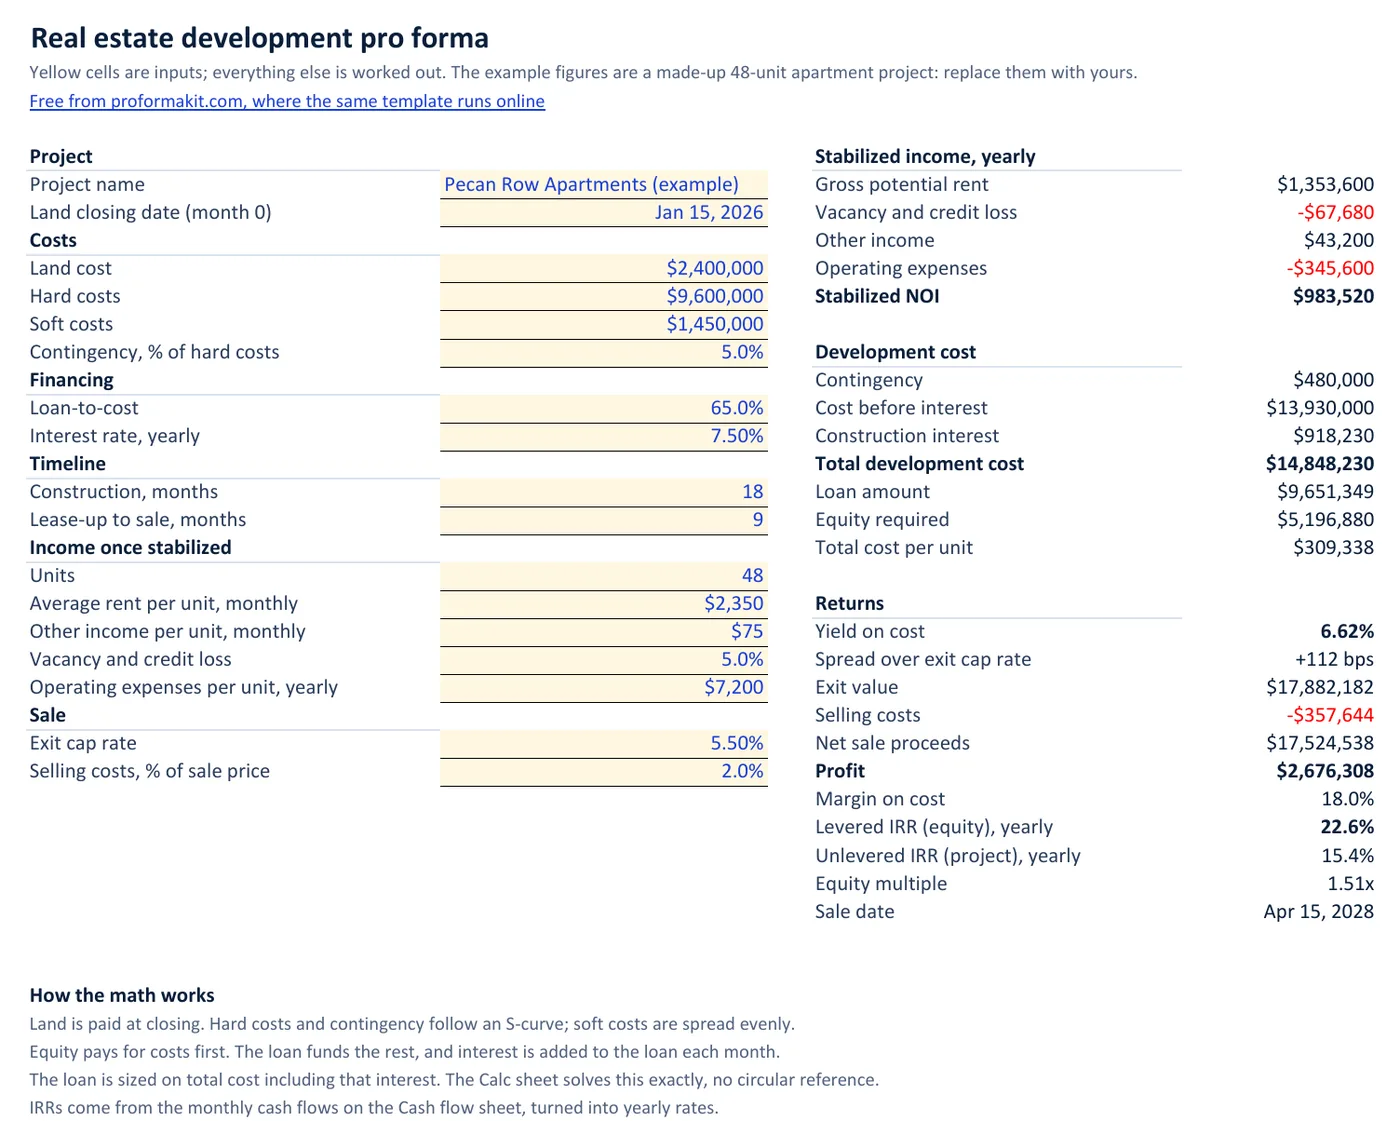
A free pro forma for building apartments: enter units, rents, vacancy and operating costs per unit along with land, construction and the loan, and ProformaKit works out NOI, total cost per unit, yield on cost, profit and IRR month by month. The example loaded below is a 48-unit building.
Sample project Made-up numbers to show how it works. Change any of them to start your own.
Pro forma results
Total development cost
$14,848,230
Profit
$2,676,308
Margin on cost
18.0%
Yield on cost
6.62%
+112 bps over the exit cap
Levered IRR
22.6%
Return on equity, yearly
Equity multiple
1.51x
Capital stack and sale
- Loan (65% of cost)
- $9,651,349
- Equity required
- $5,196,880
- Construction interest
- $918,230
- Contingency
- $480,000
- Exit value
- $17,882,182
- Selling costs
- -$357,644
- Unlevered IRR
- 15.4%
- Sale
- Month 27, Apr 2028
- Total cost per unit
- $309,338
- Profit per unit
- $55,756
Monthly spend and funding
Equity first, then the loan
Show the monthly table
| Month | Cost | Equity | Loan draw | Interest | Loan balance |
|---|---|---|---|---|---|
| Jan 2026 | $2,400,000 | $2,400,000 | $0 | $0 | $0 |
| Feb 2026 | $89,063 | $89,063 | $0 | $0 | $0 |
| Mar 2026 | $155,581 | $155,581 | $0 | $0 | $0 |
| Apr 2026 | $280,594 | $280,594 | $0 | $0 | $0 |
| May 2026 | $449,024 | $449,024 | $0 | $0 | $0 |
| Jun 2026 | $640,556 | $640,556 | $0 | $0 | $0 |
| Jul 2026 | $832,087 | $832,087 | $0 | $0 | $0 |
| Aug 2026 | $1,000,517 | $349,975 | $650,542 | $0 | $650,542 |
| Sep 2026 | $1,125,530 | $0 | $1,129,596 | $4,066 | $1,780,137 |
| Oct 2026 | $1,192,048 | $0 | $1,203,174 | $11,126 | $2,983,311 |
| Nov 2026 | $1,192,048 | $0 | $1,210,694 | $18,646 | $4,194,005 |
| Dec 2026 | $1,125,530 | $0 | $1,151,742 | $26,213 | $5,345,747 |
| Jan 2027 | $1,000,517 | $0 | $1,033,928 | $33,411 | $6,379,675 |
| Feb 2027 | $832,087 | $0 | $871,960 | $39,873 | $7,251,634 |
| Mar 2027 | $640,556 | $0 | $685,878 | $45,323 | $7,937,513 |
| Apr 2027 | $449,024 | $0 | $498,634 | $49,609 | $8,436,146 |
| May 2027 | $280,594 | $0 | $333,320 | $52,726 | $8,769,467 |
| Jun 2027 | $155,581 | $0 | $210,390 | $54,809 | $8,979,857 |
| Jul 2027 | $89,063 | $0 | $145,187 | $56,124 | $9,125,045 |
| Aug 2027 | $0 | $0 | $57,032 | $57,032 | $9,182,076 |
| Sep 2027 | $0 | $0 | $57,388 | $57,388 | $9,239,464 |
| Oct 2027 | $0 | $0 | $57,747 | $57,747 | $9,297,211 |
| Nov 2027 | $0 | $0 | $58,108 | $58,108 | $9,355,318 |
| Dec 2027 | $0 | $0 | $58,471 | $58,471 | $9,413,789 |
| Jan 2028 | $0 | $0 | $58,836 | $58,836 | $9,472,625 |
| Feb 2028 | $0 | $0 | $59,204 | $59,204 | $9,531,829 |
| Mar 2028 | $0 | $0 | $59,574 | $59,574 | $9,591,403 |
| Apr 2028 | $0 | $0 | $59,946 | $59,946 | $9,651,349 |
The example, per unit
Developers and lenders read a multifamily deal per unit, so here is the example's $14,848,230 broken down across its 48 units.
| Line | Total | Per unit |
|---|---|---|
| Land | $2,400,000 | $50,000 |
| Hard costs | $9,600,000 | $200,000 |
| Soft costs | $1,450,000 | $30,208 |
| Contingency | $480,000 | $10,000 |
| Construction interest | $918,230 | $19,130 |
| Total development cost | $14,848,230 | $309,338 |
| Stabilized NOI, yearly | $983,520 | $20,490 |
| Value at a 5.5% cap rate | $17,882,182 | $372,545 |
| Profit | $2,676,308 | $55,756 |
From the rent roll to NOI
48 units at $2,350 a month is $1,353,600 of gross potential rent a year. 5% vacancy and credit loss takes off $67,680, and $75 a unit a month of parking, storage and pet income adds $43,200. Operating expenses of $7,200 a unit a year, for taxes, insurance, payroll, repairs and management, come to $345,600, 26.0% of effective gross income. That leaves $983,520 of stabilized NOI.
What moves a multifamily deal
Each row changes one input and leaves the rest as modelled.
| Change | NOI | Yield on cost | Profit | Levered IRR |
|---|---|---|---|---|
| As modelled | $983,520 | 6.62% | $2,676,308 | 22.6% |
| Rents 5% lower | $919,224 | 6.19% | $1,530,670 | 13.5% |
| Vacancy 10% instead of 5% | $915,840 | 6.17% | $1,470,374 | 13.0% |
| Operating expenses 10% higher | $948,960 | 6.39% | $2,060,512 | 17.8% |
| Lease-up 6 months longer | $983,520 | 6.47% | $2,329,995 | 15.5% |
Rent and vacancy hit NOI almost dollar for dollar: 5% less rent takes $64,296 off NOI, and 5 more points of vacancy takes $67,680. A 10% rise in operating expenses takes $34,560. At a 5.5% exit cap every dollar of NOI is worth $18 of value, which is why small rent assumptions move profit so much. A longer lease-up leaves NOI alone but adds interest and pushes the sale out, so it shows up mostly in total cost and the IRR.
What it leaves out for apartments
It uses one average rent, so a unit mix has to be averaged first. (New to the terms? Start with what a development pro forma is.) There are no concessions, no rent growth during lease-up and no property tax reassessment at completion; put realistic stabilized numbers in instead. Affordable housing with tax credits and condo projects sold unit by unit need a different model. The full list of what the pro forma models, and what it does not, is on the real estate development pro forma template page, and a walk-through of this same building, month by month, is in the pro forma example.
Questions developers ask
What should a multifamily development pro forma include?
Units and average rent, other income, vacancy and operating expenses per unit to get stabilized NOI; land, hard and soft costs with contingency; the construction loan and its interest; construction and lease-up months; and the exit cap rate. From those come total cost per unit, yield on cost, profit and IRR.
How do you calculate NOI for a new apartment building?
Units times average monthly rent times 12 is gross potential rent. Take off vacancy and credit loss, add other income such as parking and pet fees, then subtract operating expenses. In the example: $1,353,600 less $67,680 plus $43,200 less $345,600 is $983,520.
What is a good yield on cost for multifamily development?
There is no single number. Compare yield on cost with the cap rate a finished building would sell at: the gap is the margin for the risk of building. The example yields 6.62% against a 5.5% exit cap, +112 bps.
Does the template handle a unit mix?
Not yet. It uses one average rent across all units. For a mix of studios, one-beds and two-beds, work out the weighted average rent first and enter that.
Can I use it for build-to-rent townhomes?
Yes, as one rented community: enter the homes as units. The returns assume the community is sold at stabilization; if you plan to hold it, read the yield on cost, because refinancing and years of operation are not modelled. If the homes will be sold one by one, it does not fit, because the template values the project from NOI, not from home sales.
Is the multifamily pro forma free in Excel?
Yes. The Excel download has the same rent roll, cash flow and returns, with no email needed.
Want it for your team and your lender?
The free tool works for one person in one browser. If enough developers ask for shared projects, invoice approvals and draw packages a lender can open, those come next. Leave your email and we will write once, if they ship.